Easily View Statistics
Domestic REITs by the Number
As of April 2026
Number of Domestic REITs Managed
461REITs
As of April 2026
Asset of REITs under Management
KRW 123.39trillion
REITs Listed in the Domestic Stock Markets
KB STAR REIT , Hanwha REIT , KORAMCO THE ONE REIT , SamsungFN REIT , MASTERN PREMIER REIT , Shinhan GA REIT , SHSBREIT , MIRAEASSETGREIT , NHALLONEREIT , SK REIT , D&D platform REIT , ESRKREIT , KLI REIT , JR GLOBAL REIT , MAPS REIT 1 , IGIS RESIDENCE REIT , IGIS Value REIT , NH Prime REIT , LOTTE REIT , ShinhanAlphaREIT , E KOCREF , STAR SM REIT , KTOPREITs , A REITs
24REITs
Annual Average Growth Rate of AUM,
from 2002 to December, 2025
26.24%
Market Capitialization of the Listed REITs,
on January, 2026
9trillion 741.5billion
Average of Dividend Profit Rate of
Total REITs 2023 under Management
4.0%
(7.2% deducted from public interest policy-typed REITs with a low dividend yield)
Dividend Yield of the Listed REITs 2023
7.4%
(Market-based dividend yield of listed REITs in 2023 is 7.6%)
Overview of REITs
* Unit : billion won * Reference : Jan, 2026(Interim ag
| Classification | Number of REITs | Assets Under Management | Rate (%) |
|---|---|---|---|
| CR REITs | 25 | 4,331.6 | 3.5 |
EM REITs |
433 | 118,596.8 | 96.1 |
| SM REITs | 4 | 469.6 | 0.4 |
| Total | 461 | 123,398.0 | 100.0 |
Industry Size
Status of Annual REITs Growh and Asset Size
* Reference : 2026년 5월말 * unit: billion won
| Year | Increase of Number of REITs NoC |
Equilty | AUM | ||
|---|---|---|---|---|---|
| Newly Authorized | Authorized | Net growth | |||
| 2002 | 4 | 4 | 328.5 | 558.4 | |
| 2003 | 4 | 8 | 4 | 706.4 | 1,146.0 |
| 2004 | 2 | 10 | 2 | 801.4 | 1,436.0 |
| 2005 | 2 | 11 | 1 | 1,008.5 | 1,743.9 |
| 2006 | 4 | 14 | 3 | 1,046.3 | 3,329.6 |
| 2007 | 6 | 18 | 4 | 2,392.6 | 4,981.9 |
| 2008 | 5 | 20 | 2 | 2,774.3 | 4,872.4 |
| 2009 | 19 | 36 | 16 | 3,997.9 | 6,989.1 |
| 2010 | 17 | 50 | 14 | 3,659.7 | 7,631.2 |
| 2011 | 31 | 69 | 19 | 4,199.6 | 8,230.8 |
| 2012 | 18 | 71 | 2 | 5,400.2 | 9,529.1 |
| 2013 | 20 | 80 | 9 | 5,915.6 | 11,787.6 |
| 2014 | 27 | 98 | 18 | 7,047.8 | 14,968.2 |
| 2015 | 41 | 125 | 27 | 8,407.0 | 18,018.0 |
| 2016 | 57 | 169 | 44 | 10,734.4 | 25,092.8 |
| 2017 | 36 | 193 | 24 | 12,734.0 | 34,883.4 |
| 2018 | 36 | 217 | 24 | 14,534.2 | 43,900.9 |
| 2019 | 50 | 248 | 31 | 17,123.6 | 51,856.0 |
| 2020 | 61 | 282 | 34 | 21,692.4 | 65,270.1 |
| 2021 | 62 | 315 | 33 | 26,472.9 | 78,235.5 |
| 2022 | 55 | 350 | 35 | 31,642.2 | 89,871.8 |
| 2023 | 36 | 369 | 19 | 34,464.2 | 96,658.1 |
| 2024 | 50 | 399 | 30 | 37,997.9 | 105,336.7 |
| 2025 | 55 | 447 | 47 | 43,937.5 | 117,866.9 |
| 2026.6월말 | 24 | 469 | 22 | 47,919.5 | 127,498.6 |
Status of the Domestic Listed REITs
* Unit : billion won * Reference : 2026년 6월말(AUM 연결기준)
NoC
Market Cap.
AUM
Annual Dividend Yields
* Reference : 2024년
※ In 2007~2009, CR REITs were liquidaqted (reflecting real esate sales difference), and the average dividend t yields had reached a temporarily high. rate.
* Reference : 2024년
| Year | CR REITs | EM REITs | Listed REITs | Average Yields |
|---|---|---|---|---|
| 2002 | 8.5 | 8.9 | 8.5 | |
| 2003 | 6.6 | 7.1 | 6.6 | |
| 2004 | 8.4 | 8.7 | 8.4 | |
| 2005 | 12.2 | 11.9 | 12.2 | |
| 2006 | 12.1 | 10.1 | 11.1 | 11.9 |
| 2007 | 49.0 | 7.4 | 70.3 | 40.4 |
| 2008 | 40.3 | 6.3 | 93.8 | 28.0 |
| 2009 | 40.0 | 7.2 | 71.7 | 26.1 |
| 2010 | 10.4 | 6.4 | 9.9 | 8.6 |
| 2011 | 9.9 | 6.4 | 6.0 | 8.3 |
| 2012 | 9.4 | 4.9 | 3.7 | 7.1 |
| 2013 | 16.2 | 4.2 | 7.0 | 9.2 |
| 2014 | 9.4 | 4.6 | 2.8 | 6.2 |
| 2015 | 10.1 | 7.3 | 7.1 | 8.1 |
| 2016 | 7.0 | 5.8 | 3.1 | 6.0 |
| 2017 | 10.6 | 2.7(4.1) | 4.4 | 4.1(7.6) |
| 2018 | 15.8 | 2.8(6.4) | 11.1 | 4.4(9.2) |
| 2019 | 15.8 | 3.2(8.1) | 7.7 | 4.2(9.5) |
| 2020 | 23.2 | 4.3(10.2) | 7.1 | 5.5(12.0) |
| 2021 | 39.1 | 4.9(10.3) | 7.7(5.2) | 6.2(12.6) |
| 2022 | 12.3 | 5.0(9.7) | 7.8(6.4) | 5.2(9.9) |
| 2023 | 9.7 | 3.9(7.1) | 7.4(7.6) | 4.0(7.2) |
| 2024 | 8.4 | 5.6(7.1) | 7.5(8.1) | 5.7(7.2) |
※ The annaul average yields are equivalent to dividend yields (incluing liquidaqted REITs) as to average paid-in capital (equity capital + capital surplus)
※ Public interest Policy-typed REITs (public rental REITS, social priviate rental REITs ) suffer a fall in average yields by non-dividend, during the period of opeation. Thus, yields except policy REITs are reckoned separately in ( )
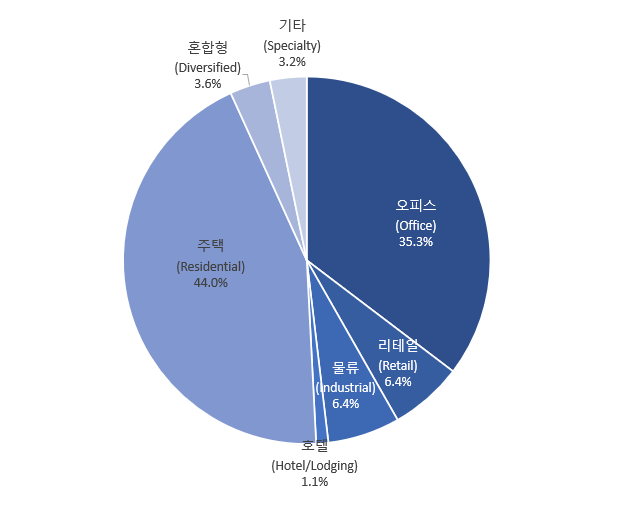
Portfolio & Dividends by Property Sector
* Reference : JAN, 2026
* Reference : JAN, 2026
| Classification | NoC | Asset Under Management | Market Share(%) |
|---|---|---|---|
| Office | 113 | 43,601.1 | 35.3% |
| Retail | 28 | 7,932.3 | 6.4% |
| Industrial | 45 | 7,847.2 | 6.4% |
| Hotel/Lodging | 10 | 1,315.1 | 1.1% |
| Residential | 231 |
54,322.1 | 44.0% |
| Diversified | 21 | 4,397.2 | 3.6% |
| Specialty | 13 | 3,988.1 | 3.2% |
| Total | 461 | 123,397.7 | 100.0% |
Performance by Property Location
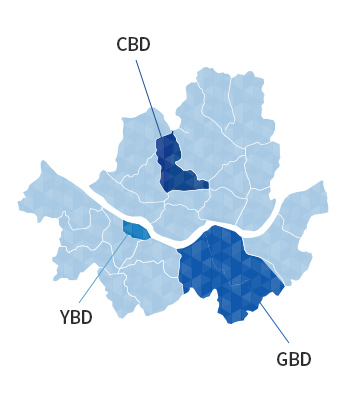
Seoul
-
4,567.3
/ 4.4%CBD
Central Business District
-
5,657.9
/ 7.4%GBD
Gangnam Business District
-
1,873.1
/ 44.3%YBD
Yeouido Business District
-
4,919.7
/ 20.4%ETC
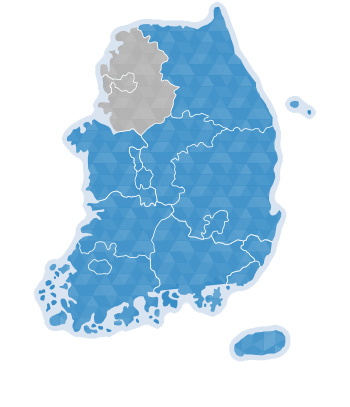
Except for Seoul
-
8,046.7
/ 6.2%Seoul
Metropolitan
Area -
2,113.4
/ 9.6%Regins
-
6,438.3
/ 5.8%Nationwide

Overseas
-
2,048.3
/ 6.2%
* Reference : Q3, 2021
| Classification | SM REITs | Seoul metropolitan | Regionl | Nationawide | Overseas | Total | ||||
|---|---|---|---|---|---|---|---|---|---|---|
| CBD | GBD | YBD | ETC | |||||||
| EM REITs | AUM | 4,351.8 |
5,094.1 |
1,762.1 |
2,885.0 |
6,499.4 |
1,564.9 |
6,395.0 |
1,630.4 |
30,182.7 |
| Yield | 3.9% |
6.0% |
5.5% |
1.9% |
10.8% |
6.5% |
7.8% |
3.0% |
6.6% |
|
| CR REITs | AUM | 220.2 |
546.1 |
76.4 |
1,236.9 |
691.7 |
391.8 |
- | - | 3,163.0 |
| Yield | 296.5% |
17.9% |
7.1% |
223.4% |
16.0% |
5.8% |
- | - | 115.5% |
|
| Sum/Avg. | AUM | 4,572.0 |
5,640.2 |
1,838.4 |
4,121.9 |
7,191.1 |
1,956.7 |
6,395.0 |
1,630.4 |
33,345.7 |
| Yield | 18.0% |
7.2% |
5.6% |
68.4% |
11.3% |
6.4% |
7.8% |
3.0% |
16.9% |
|
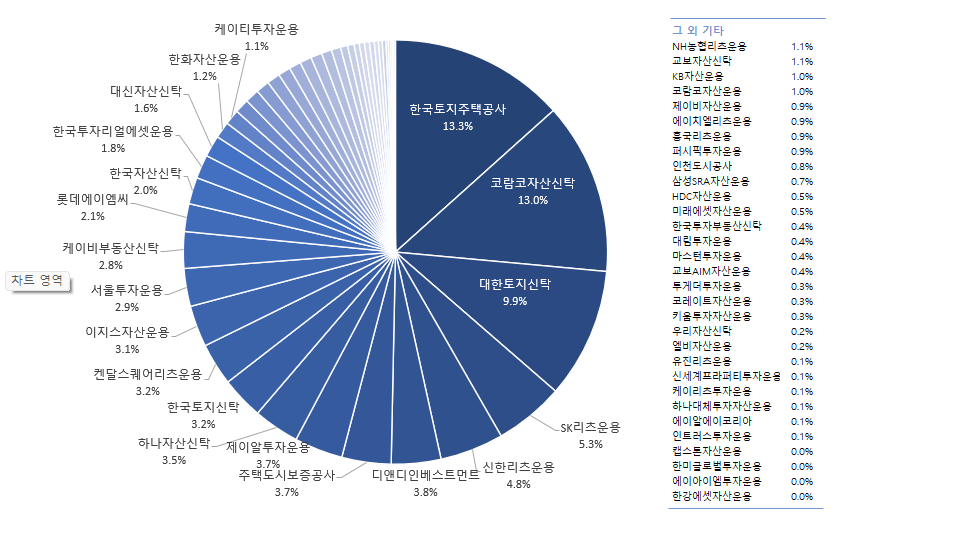
Asset Management Companies Report
* Reference : JAN, 2026
* Reference : JAN, 2026
| AMC | NoC | AUM | M/S |
|---|---|---|---|
| Korea Land & Housing Cprporation | 31 | 16,361.5 | 13.3% |
| Koramco Asset Management and Trust Co. | 45 | 16,048.3 | 13.0% |
| Daehan Real Estate Trust Co. | 68 | 12,223.0 | 9.9% |
| SK AMC | 4 | 6,499.6 | 5.3% |
| Shinhan Real Estate Investment Trusts Co. | 23 | 5,932.8 | 4.8% |
| D&D Investment | 28 | 4,623.3 | 3.8% |
| HUG | 10 | 4,590.5 | 3.7% |
| JR Investment Management Co. | 8 | 4,518.0 | 3.7% |
| Hana Asset Trusts | 29 | 4,286.6 | 3.5% |
| KOREIT(Korea Real Estate Invesmtment Trusts) | 21 | 4,012.3 | 3.3% |
| Kendall Sqaure REITS Management | 4 | 3,940.1 | 3.2% |
| IGIS Asset Management | 11 | 3,860.6 | 3.1% |
| Seoul Investment Management | 12 | 3,532.5 | 2.9% |
| KB Real estate Trust Co. | 19 | 3,406.7 | 2.8% |
| Lotte AMC | 1 | 2,594.4 | 2.1% |
| KAIT (Korea Asset Investment Trusts) | 16 | 2,484.9 | 2.0% |
| KIRA(Korea Investment Real Asset) | 1 | 2,215.9 | 1.8% |
| Daishin Asset Trust | 9 | 1,995.2 | 1.6% |
| Hanwha Asset Management | 1 | 1,539.9 | 1.2% |
| KT AMC | 8 | 1,408.1 | 1.1% |
| NHREITs Management | 8 | 1,334.0 | 1.1% |
| Kyobo Asset Trust | 8 | 1,311.9 | 1.1% |
| KB Asset Management | 4 | 1,264.4 | 1.0% |
| Koramco Asset Management | 2 | 1,228.8 | 1.0% |
| JB Asset Management | 6 | 1,154.3 | 0.9% |
| Hanla REITs Management | 7 | 1,100.6 | 0.9% |
| HeungKook AMC | 2 | 1,091.3 | 0.9% |
| Pacific Investment Management Company | 11 | 1,047.0 | 0.9% |
| IH | 5 | 951.7 | 0.8% |
| Samsung SRA Asset Management | 1 | 868.1 | 0.7% |
| HDC Asset Management | 3 | 661.5 | 0.5% |
| Mirae Asset Management | 3 | 612.0 | 0.5% |
| KIRET(Korea Investment of Real Estate Trusts) | 3 | 478.9 | 0.4% |
| Kyobo AIM Asset Management | 1 | 444.4 | 0.4% |
| Mastern Investment Management | 5 | 495.2 | 0.4% |
| Darim AMC | 4 | 477.6 | 0.4% |
| Together Investment Management | 6 | 380.9 | 0.3% |
| KOREIT(Korea Real Estate Invesmtment Trusts) | 2 | 362.8 | 0.3% |
| Kiwoom Asset Management | 1 | 335.8 | 0.3% |
| Woori AMC | 6 | 219.5 | 0.2% |
| LB Asset Management | 1 | 212.6 | 0.2% |
| Eugine AMC | 1 | 154.3 | 0.1% |
| Shinsegae Property Investment Management | 1 | 147.8 | 0.1% |
| KREITs Investment Management | 1 | 147.4 | 0.1% |
| Hana Alternative Asset Management | 1 | 98.4 | 0.1% |
| ARA KOREA | 1 | 89.8 | 0.1% |
| Intrus Investment Management | 1 | 89.1 | 0.1% |
| Capstone Asset Management | 1 | 40.5 | 0.0% |
| HanmiGlobal Asset Management | 1 | 28.9 | 0.0% |
| AIM Investment Management | 1 | 27.1 | 0.0% |
| Hangang Asset | 1 | 0.2 | 0.0% |
| Daol Asset Management Co. | (2020.06.11. 인가) | ||
| Heritage Capital Management | (2021.11.30. 인가) | ||
| Mugunghwa Trust Co.LTD | (2021.12.03. 인가) | ||
| VESTAS Investment Management Co. | (2022.05.20. 인가) | ||
| METHEUS Asset Management Co. | (2022.12.21. 인가) | ||
| Leading Asset Management Co. | (2023.02.06. 인가) | ||
| Bluecove Investment | (2023.06.27. 인가) | ||
| ADF Investment | (2024.02.28. 인가) | ||
| Welcome Asset Management | (2024.04.26. 인가) | ||
| Orion Capital Management | (2024.05.03. 인가) | ||
| GMCC | (2024.05.21. 인가) | ||
| GH | (2024.09.12. 인가) | ||
| D&O AMC | (2025.02.27. 인가) | ||
| United Partners Asset Management | (2026.01.19. 인가) | ||
| Sub-Total | 453 | 122,772.3 | 99.6% |
| Self-Management REITs | 4 | 469.6 | 0.4% |
| Total | 457 | 113,241.9 | 100.0% |
AMC Status Approved AMC
* Reference : 2026.06월말
| Year | Total AMC | New Approved AMC | Cancel/Withdrawal |
|---|---|---|---|
| 2002 | 4 | 4 | |
| 2003 | 6 | 2 | |
| 2004 | 6 | ||
| 2005 | 7 | 1 | |
| 2006 | 8 | 1 | |
| 2007 | 10 | 2 | |
| 2008 | 15 | 5 | |
| 2009 | 18 | 3 | |
| 2010 | 17 | 0 | 1 |
| 2011 | 21 | 5 | 1 |
| 2012 | 22 | 1 | |
| 2013 | 22 | 1 | 1 |
| 2014 | 21 | 1 | 2 |
| 2015 | 22 | 2 | 1 |
| 2016 | 25 | 4 | 1 |
| 2017 | 27 | 3 | 1 |
| 2018 | 29 | 5 | 3 |
| 2019 | 31 | 3 | 1 |
| 2020 | 36 | 6 | 1 |
| 2021 | 51 | 17 | 2 |
| 2022 | 56 | 5 | 0 |
| 2023 | 58 | 3 | 1 |
| 2024 | 63 | 8 | 3 |
| 2025 | 65 | 4 | 3 |
| 2026.6월말 | 66 | 3 | 1 |
※87 asset management companies were approved and 22 companies were cancelled and withdrawn from being authorized. A total of 65 AMC are being managed.
Korea Association of Real Estate Investment Trusts
6, Yeouidaebang-ro 65-gil, Yeongdeungpo-gu, Seoul, Republic of Korea(YeouidoDong, Center Building) 07333Business Registration Number : 211-82-17316 Date of Approval by Ministry of Land, Infrastructure, and Transport : 2010.12.30 Telephone : plan2@kareit.or.kr Fax : 02-544-6670
- Telephone 02-544-9862
- Membership Support Team 02-2135-9868
- REITs Policy Team 02-2135-9869
- REITs Education Team 02-2135-9863
- Financial Support Center 02-2135-9861
Copyright © 2009-2020 KOREA ASSOCIATION OF REAL ESTATE INVESTMENT TRUST. All rights reserved.
